For the Market Share Report, there are four options to base the search criteria on. You can see the market share based on publisher, distributor, subject, or format. To select one of these for your report, select the appropriate tab and fill out the criteria in that page. The first box in all three tabs will change based on which one is selected, but the remainder of the fields for comparison are exactly the same.
| Top Tip: The Market Share report excludes sales of titles with blank rows or missing bibliographic data in any of these fields: Publisher, Distributor, Format, and Subject. To ensure an accurate comparison, we must have good quality bibliographic data for titles included in this report. |
1. Select the market share
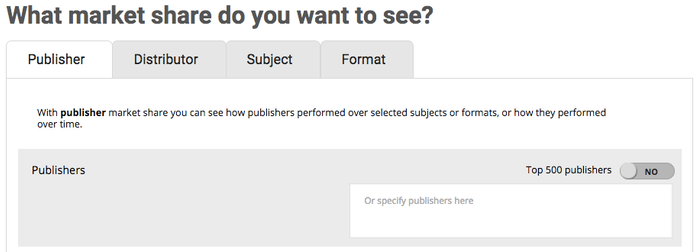
- Publisher: With Publisher Market share you can see how publishers performed over selected subjects or how they performed over time. Publisher is the default tab when you open the Market Share page. Before running the report you must specify which publishers you would like to see in your report in the provided text box, or you can check off Top 500 Publishers.
- Distributor: With distributor market share you can see how distributors performed over selected subjects or formats, or how they performed over time. Once you have selected Distributor as the market you would like to view from the tab at the top, you must specify which distributors you would like to see in your report in the provided text box, or you can check off Top 500 Distributors.
- Subject: With subject market share you can see how subjects performed over time. Once you have selected Subject as the market you would like to view, click on the Add/Edit Subjects box and choose which subjects you would like to see in your report. If you use this tab, the box asking "How do you want to compare these" will not appear.
- Format: With format market share you can see how formats performed over time. Once you have selected Format as the market you would like to view from the tab at the top of the Market Share page, click on the Add/Edit Formats box and choose which binding formats you would like to see in your report. If you use this tab, the box asking "How do you want to compare these" will not appear.
2. Decide how to compare the data
- Format: If you select formats simply click Add/Edit Subjects to drill down and choose the specific binding formats you want to see. Selecting a top-level category will not automatically select its children. The formats here are independent of each other. Selecting "Hardcover" will only return a single column for Hardcover that shows the total sales for that entire category.
- Subject: By default, all six top-level subjects are already selected. To change this, or to select a specific subject category, click on the Add/Edit Subjects button to open a menu showing the different subject categories. Selecting a top-level category will not automatically select its children. The subjects here are independent of each other. Selecting "Fiction" will only return a single column for Fiction that shows the total sales for that entire category.
- Over Time: Allows you to modify the reporting period by Snapshot, Consecutive Weeks/Months/Quarters, or Year Over Year.
- Snapshot: Gives you a report with preset columns showing the selected week, previous week, year to date, last year to date, last year, and 2 years previous. You are given the option here to choose the week ending date for that data.
- Consecutive Weeks/Months/Quarters: Allows you to choose reporting intervals to appear in the columns, either weeks, months, or quarters. You may choose the ending date, and the number of weeks/months/quarters to display.
- Quarters are calculated based on the calendar year as follows:
- Q1 = January to March
- Q2 = April to June
- Q3 = July to September
Q4 = October to December
- Quarters are calculated based on the calendar year as follows:
- Year over year: Allows you to see the same reporting interval over the past ten years. Each year's data is displayed in a separate column. Here you can choose to see data from the same month, quarter, year-to-date, or year over the last ten years. You will be given an option to specify which month, quarter, or year to use..
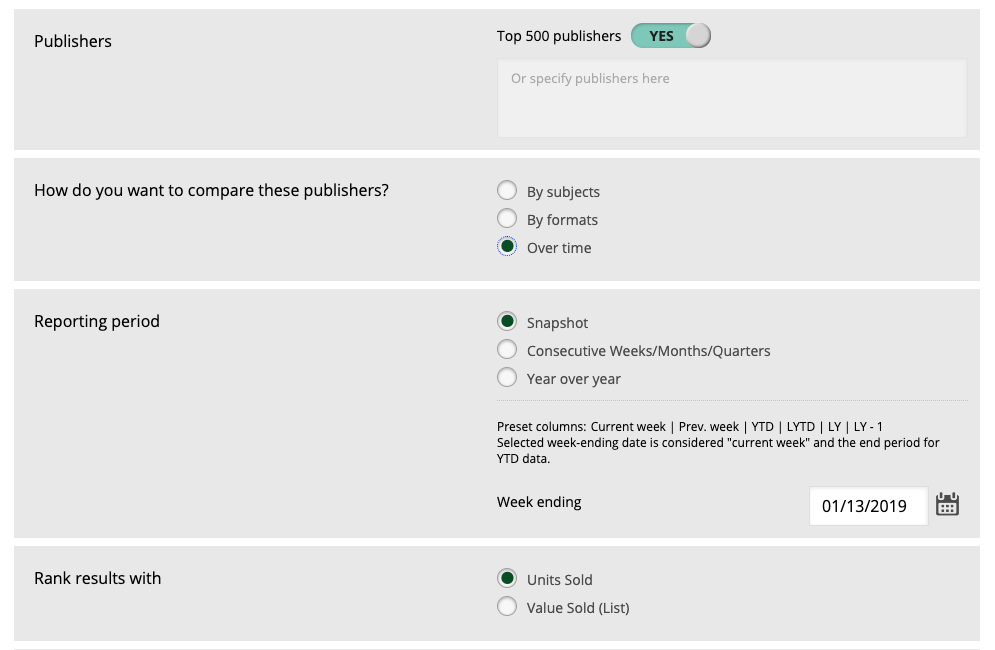
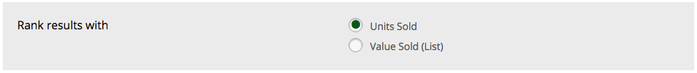
3. Rank results with Units Sold or Value Sold (List)
You can choose to rank the results in Units Sold or Value Sold (List) by simply clicking one of these options. Both values will appear in the results but the table will be ranked only according to your choice.
4. Run Report
Once you have selected the criteria you wish to see you can run your report, or download/email it.
Find more information on downloading, emailing, saving, and distributing your reports here.
Tutorial Video
Watch our video tutorial to learn how to build a Market Share Report:
Results
Learn more about Market Share Report results here.