If a retailer has given their permission for your account to see your titles in their data, you are able to look at data through what we call market or peer views of the data.
Certain columns will appear only in special circumstances. For example, the columns "% Sell Through" and "Stock Turn" will only appear if the selected market is only associated with a single provider and that provider supplies us with OH and OO data. If these do not automatically appear on the table, click Customize Columns and check off the ones you want to see in the pop-up window that appears.
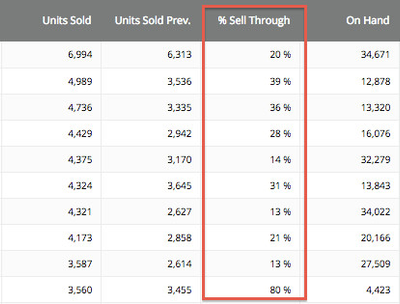
Retailer Single Week Reports: % Sell-Through
The % Sell Through column displays only on single-week reports when a specific retailer has been searched. This column shows the rate at which the title is selling, using the formula Units Sold/On Hand Inventory.
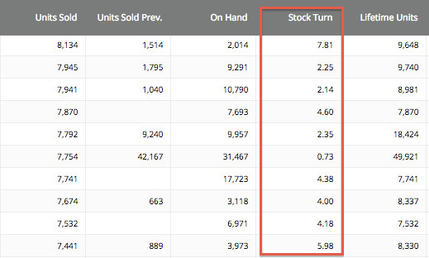
Multi-week Reports: Stock Turn
The Stock Turn column displays only on multi-week, peer view reports.
Stock Turn is measured by using the formula [(Average OH/Average Units Sold)/Number of weeks in report] x 52 to annualize the number.
Please note that Multi-week reports do not show the following data points:
- Prev. Rank
- On Hand
- On Order
- No. of Stores