...
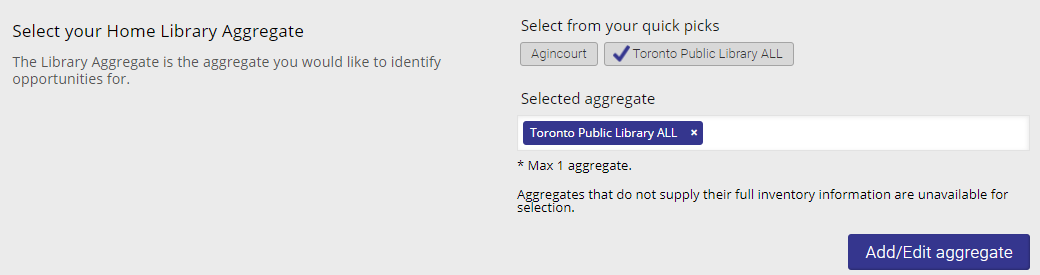
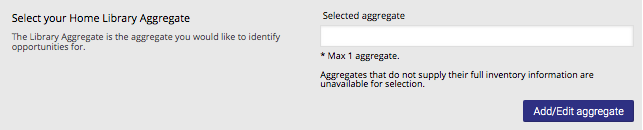
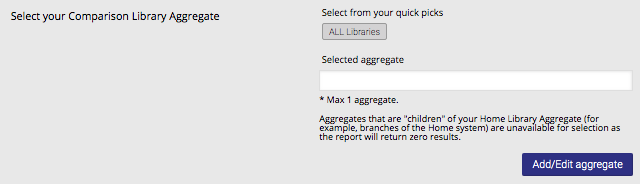
The Home Library Aggregate is the library you would like to identify opportunities for. The Quick Picks section shows recommended aggregates based on the ones you commonly use. To choose a different aggregate, click the Add/Edit Aggregate button to open a menu.
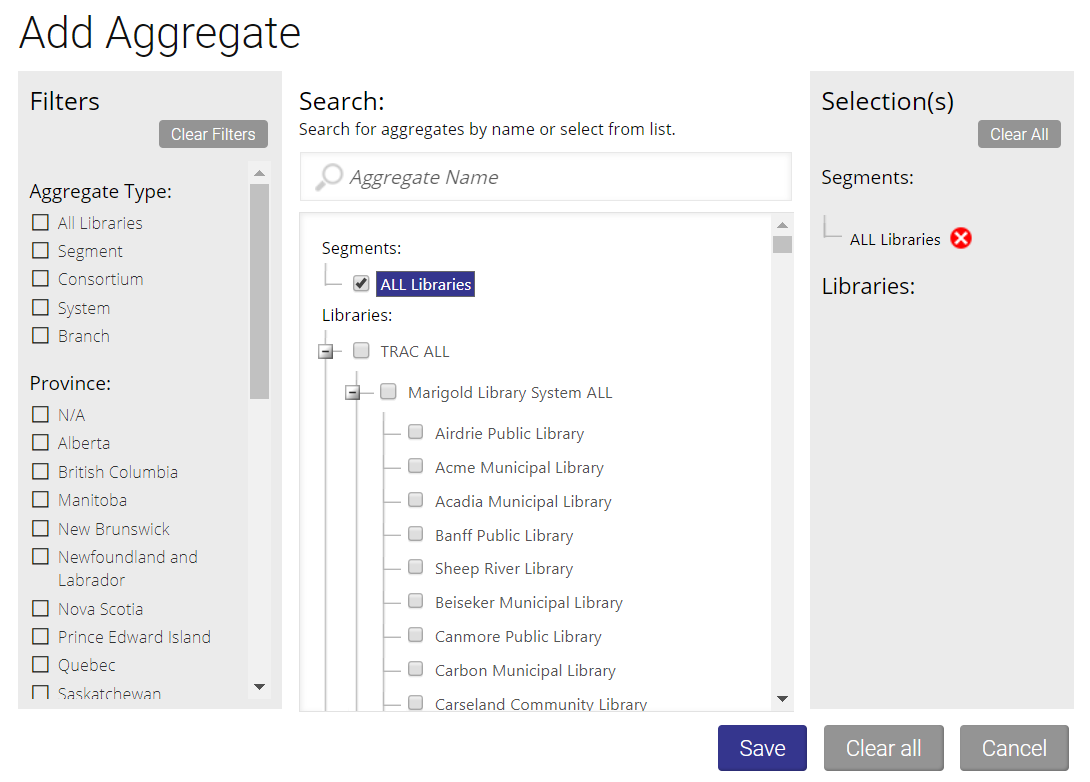
From there, you can filter aggregates based on: type, province, population density, population served, budget, tier, and branch focus. You can also search for specific aggregates by name or from a list.
...
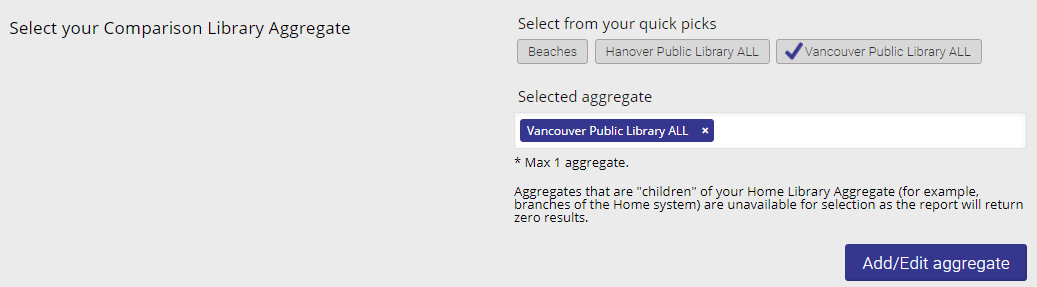
In this section, you can choose the aggregate you would like to compare data with. Note that aggregates that are "children" of your Home Library Aggregate (for example, branches of the Home system) are unavailable for selection as the report will return zero results.
Additional Aggregates
...
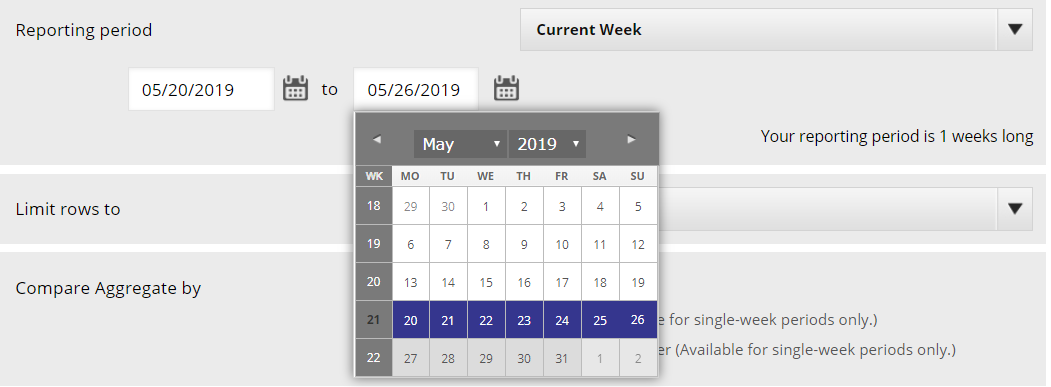
The default display for Custom Period is the most recent week. To select a different time period, click on the date boxes or calendar icons below to enter the starting and ending date of the reporting period.
Note that if you select a Custom reporting period that covers 208 periods (weeks) or more, the Run Report button will turn grey and a message will pop up informing you that this report is only available through the download option. While your report is downloading you are free to create other reports and use LibraryData. A downloading icon will pop up in the lower left-hand part of your screen while the report is running. To minimize this simply click on the arrow icon in the top right-hand corner. For more information on the Download Manager, check out the help page for it here.
| Info | ||
|---|---|---|
| ||
The calendar weeks can display as greyed out for two reasons:
|
...
Watch our tutorial video to learn more about building a Collection Gaps Report:
| Iframe | ||||||
|---|---|---|---|---|---|---|
|
Results
Learn more about the Compare to Library Report Results here.
...