tocTable of Contents
February 2020
Over Time: Snapshot Reporting Periods now include Last Year to Date (LYTD)

When you select the “Snapshot” reporting period in the Multi-ISBN, Market Comp, or Market Share report, the results columns in your report now include Last Year to Date alongside the total sales for last year and the previous year, giving the YTD number a useful comparator against the previous year.
Over Time: Year over Year reporting now allows Year-to-Date over Year to Date comparison

When you select the “Year over Year” reporting period in the Multi-ISBN, Market Comp, or Market Share report, you can now compare Year to Date to the same number of weeks in each of the previous 9 years. This is a great tool to evaluate how you’re doing over the course of a year, and how it stacks up against the same time last year!
Top tip: Set up a saved report using the Year To Date Year over Year selection to get a quick update each week!
Popular Request: The On-Order column is now available in the Multi-ISBN Report!
The Research Portal has had a makeover as well! Now you can see and download our newest research right from the SalesData homepage.
That’s right! You asked, we answered. At long last, the On Order column is available in the Multi-ISBN report for single-week reporting periods. Paired up with the Searchable Criteria and Rolling Pub Date options, this makes the Multi-ISBN report even more powerful for tracking forthcoming and currently-selling titles.
September 2019
Coming soon: LibraryData!
...
We have updated this to better reflect the marketplace and the data we have available to better account for copies that may have been received and sold during a week period. This change better reflects sell through, especially for new books.
The calculation is now: Units sold in the given period / (On Hand in the given period + Units Sold in the given period)
So, for a book this week that has 10 Units Sold and 50 copies On Hand:
...
When setting up a Buying Gaps report, you may notice that some markets' names in the "Select a home market" dropdown are now followed by an asterisk (*):
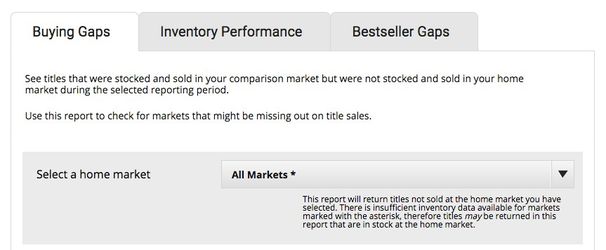
Markets with an asterisk have insufficient inventory data, usually because one or more of the retailers contributing to that aggregate don't supply inventory data. This means the Buying Gaps report may return titles that are in stock in the selected home market, since the inventory data we have is incomplete and therefore can't be verified. The Buying Gaps report will always return titles that have no sales reported in the selected home market.
Gap Analysis: Inventory Performance
The "Select a home market" dropdown in the Inventory Performance Gap Analysis report has also been modified so you can more easily identify markets with complete and actionable inventory data available — after all, you can only analyze inventory performance if you have data about a market's inventory!
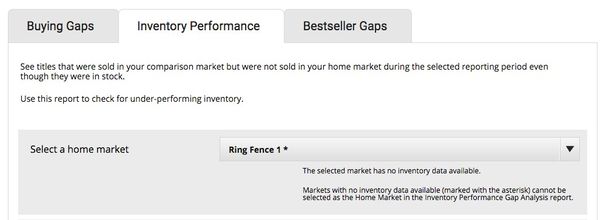
To make your Inventory Performance home market selection process speedier, we've marked aggregates with unavailable inventory data with an asterisk (*), and you will not be able to run Inventory Performance reports on home markets without inventory data.
Update your saved passwords!
The password for the SalesData Research Portal has changed, so if you want access to all of BookNet's subscriber-only research reports you'll want to swing by the Research Portal box in the right-hand sidebar of the home page for the new password.
...
July 2017
Home Page Customization: You can now view your home page data in either Units Sold or Value Sold (List)
...